
Building…
More features, more code, longer compile time. Probably you heard about some tips and tricks how to improve it. Do you think that this code improvement makes your compilation faster? It is a good idea to have a specific determinant before doing it. The best approach will be measuring the compile time before particular improvement and measure it after that.
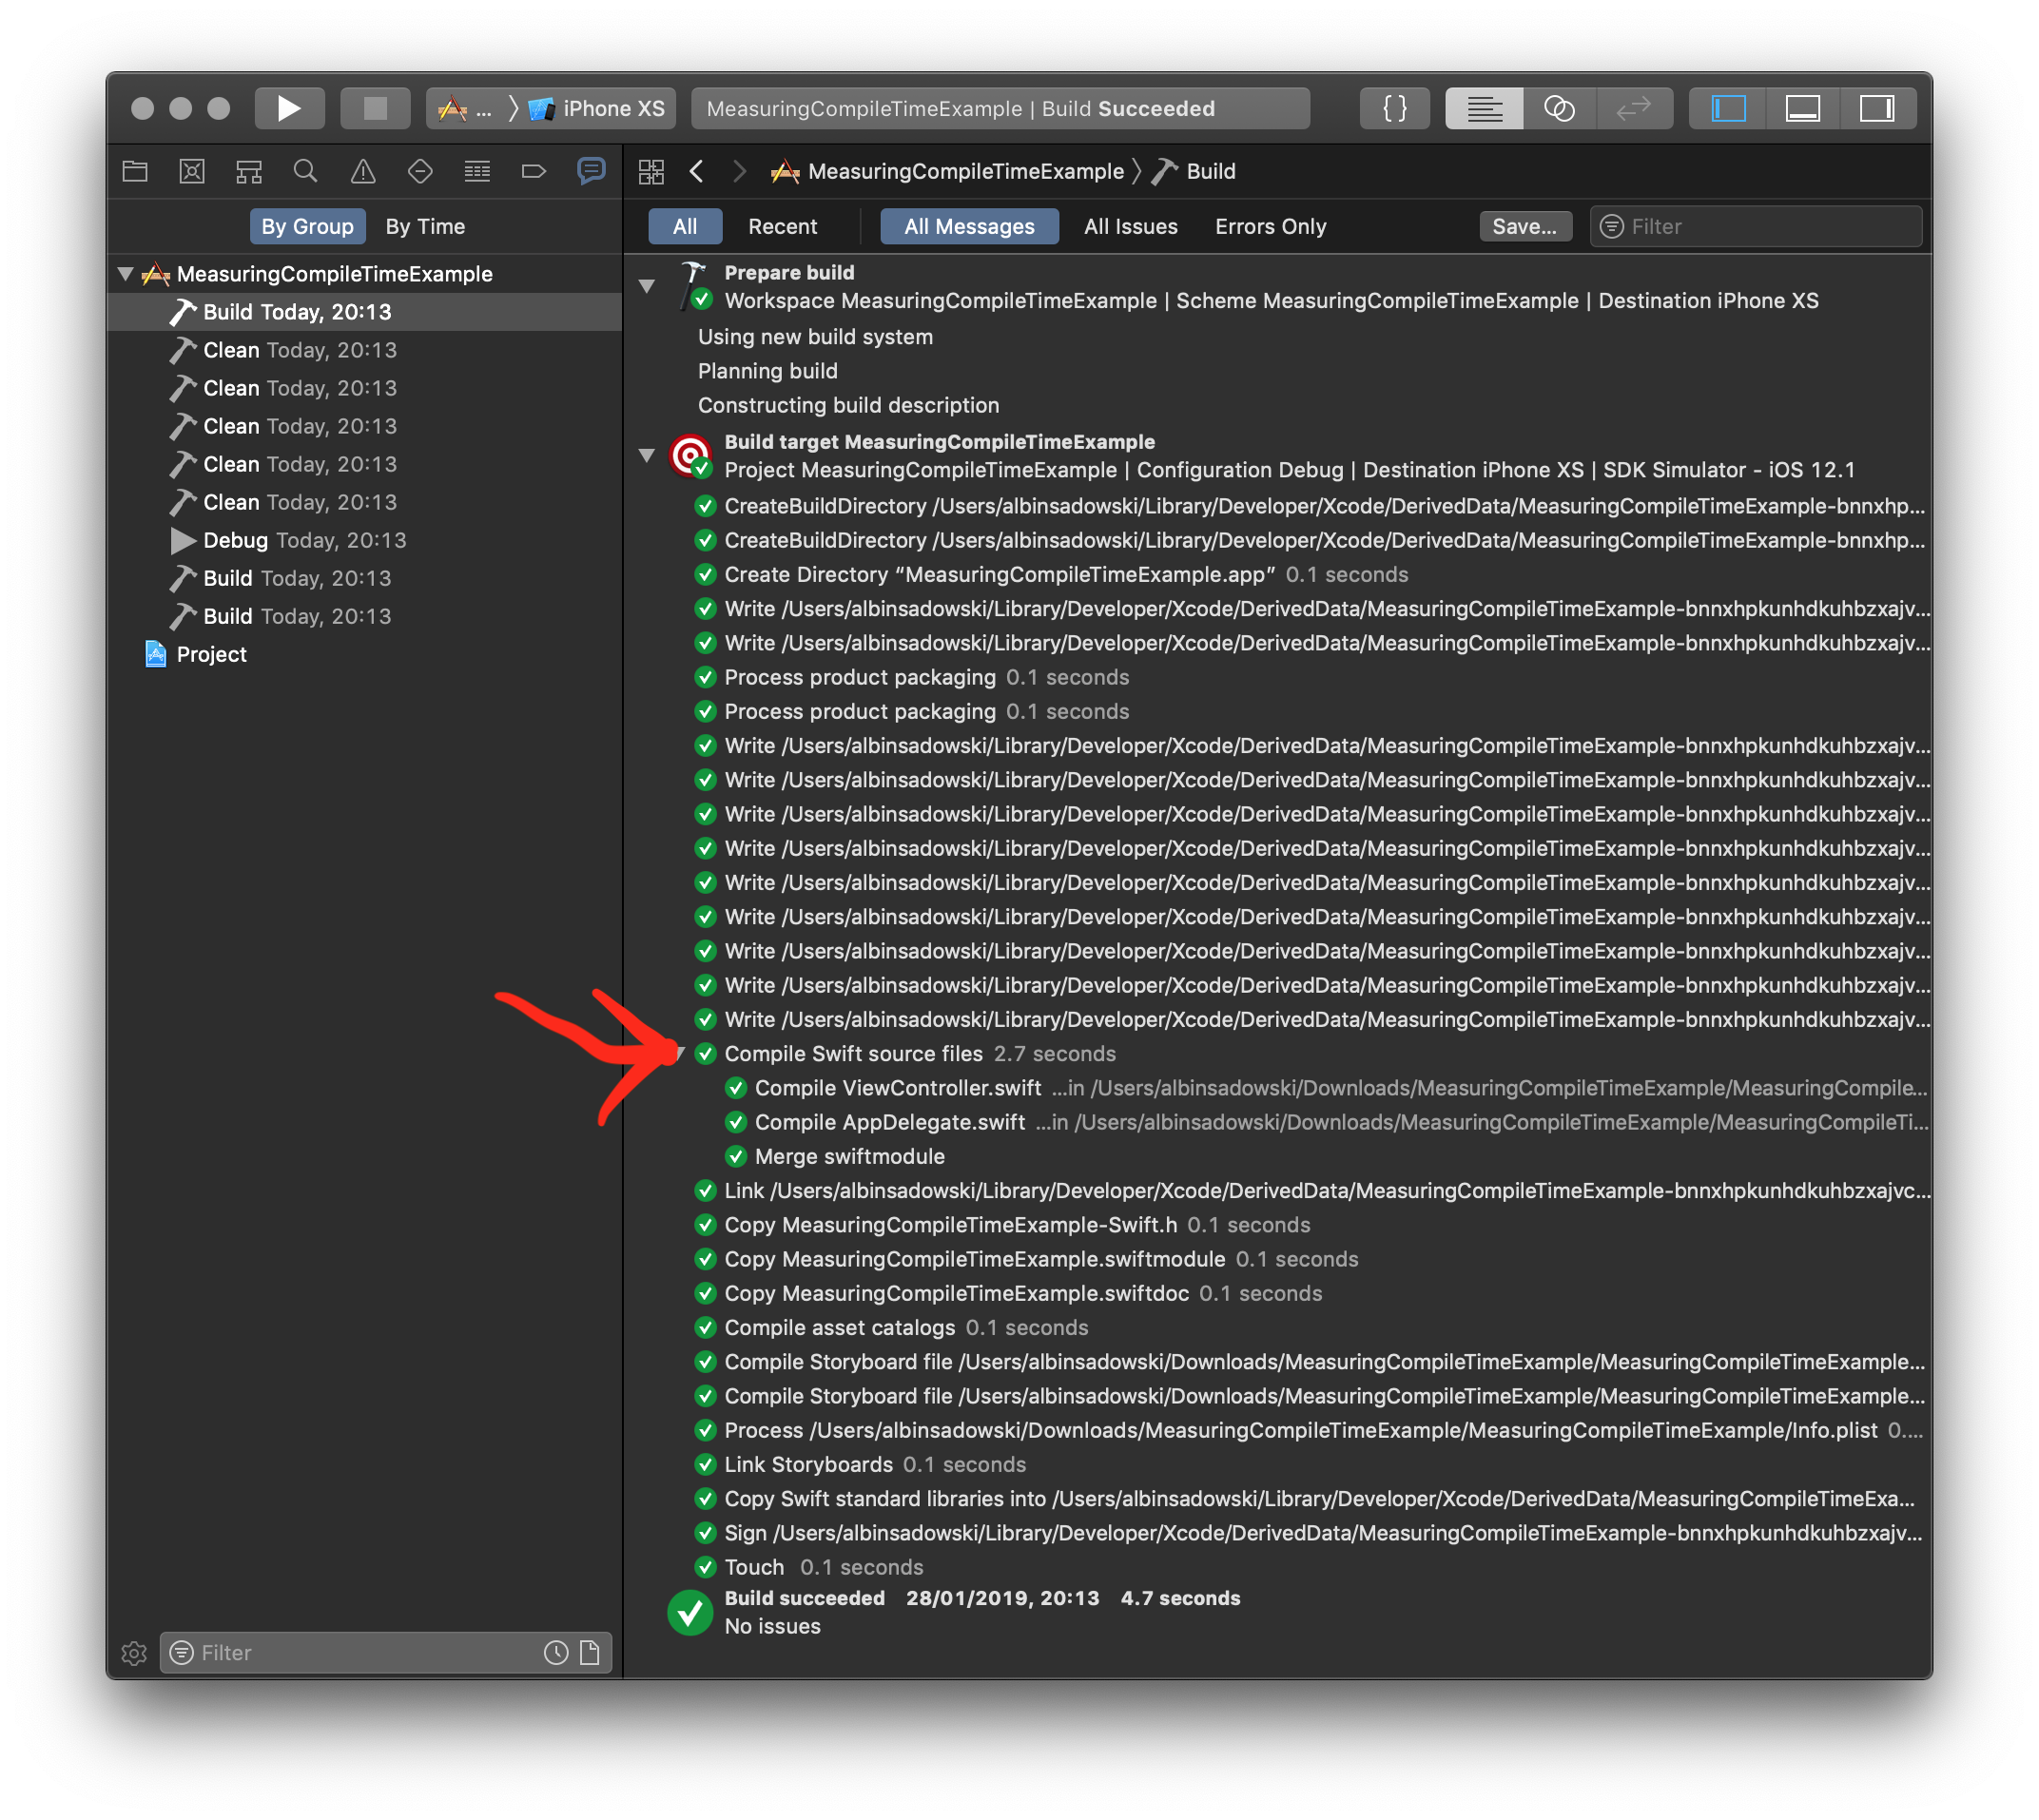
Using Report navigator
The simplest way is to open Report navigator in Xcode (⌘+9 shortcut key), select a particular build and look at the time next to Compile Swift source files phase.
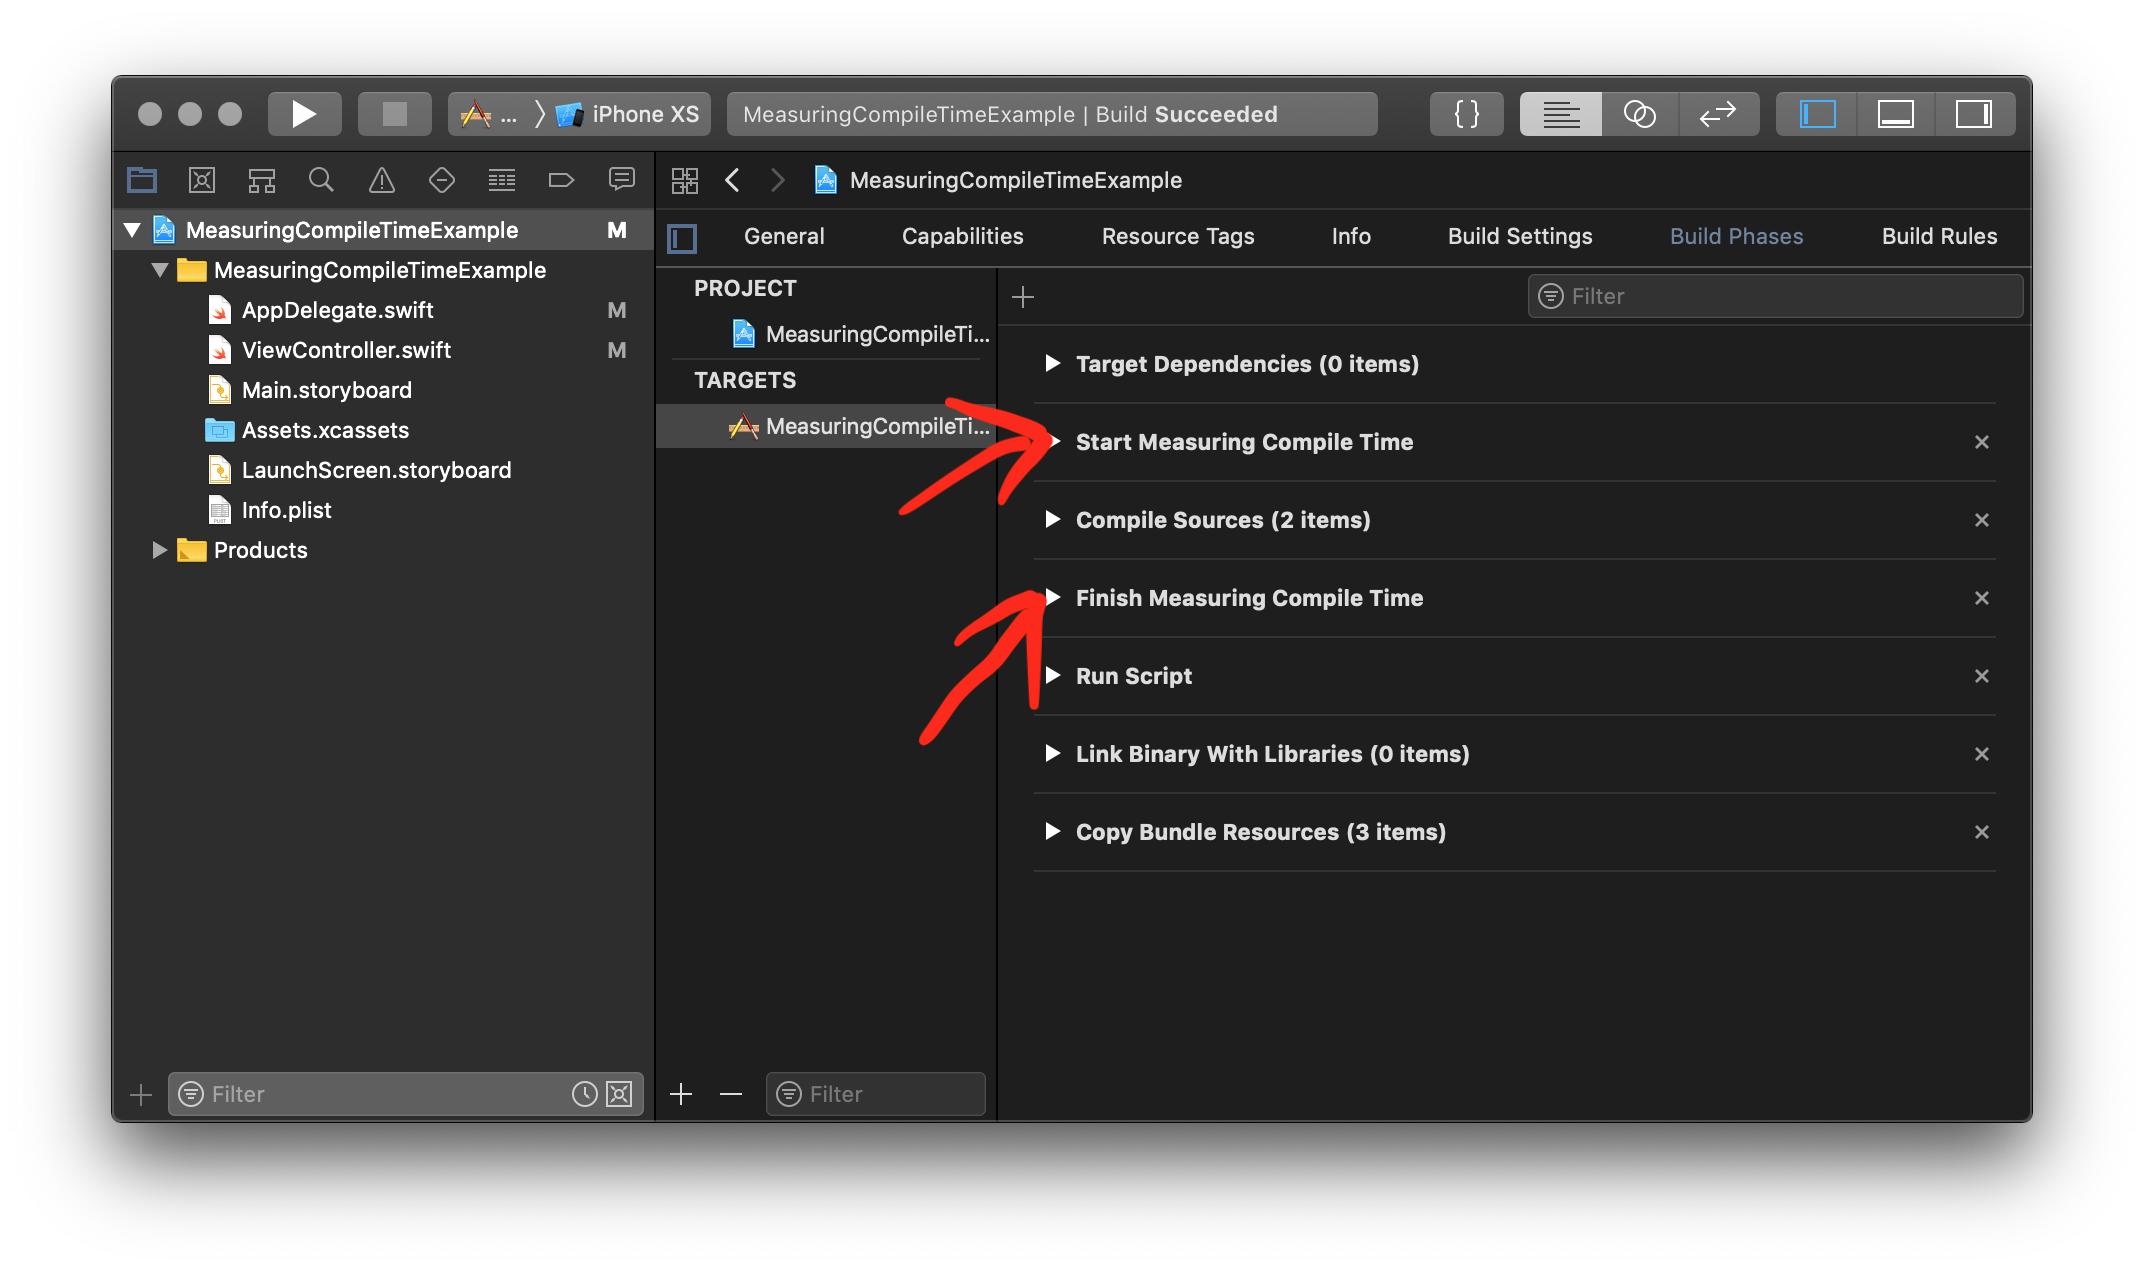
Using a script
Another idea is using a script. Gather the time before building and after it, calculate the difference and voilà! Now you know what is your compile time.
Add this Script Phase before Compile Sources phase:
date_now_in_miliseconds=$(python -c 'from time import time; print int(round(time() * 1000))')

echo $date_now_in_miliseconds > "measured_compile_time.log"
Add this Script Phase after Compile Sources phase:
start_time_in_miliseconds=$(<measured_compile_time.log)
finish_time_in_miliseconds=$(python -c 'from time import time; print int(round(time() * 1000))')

difference=$(($finish_time_in_miliseconds-$start_time_in_miliseconds))

echo "[Difference] $difference [ms]" > "measured_compile_time.log"
python -c 'from time import time; print int(round(time() * 1000))' is used to get a value in miliseconds (you can use also simple date +%s to receive that value in seconds).
From that moment you can check your compile time just by looking at the value in compile_time.log file. Remember about adding this measured_compile_time.log to .gitignore in your project. Thanks to it you can easily measure different places (or more phases at once) or even store these values and use it in other places (for example: in charts).
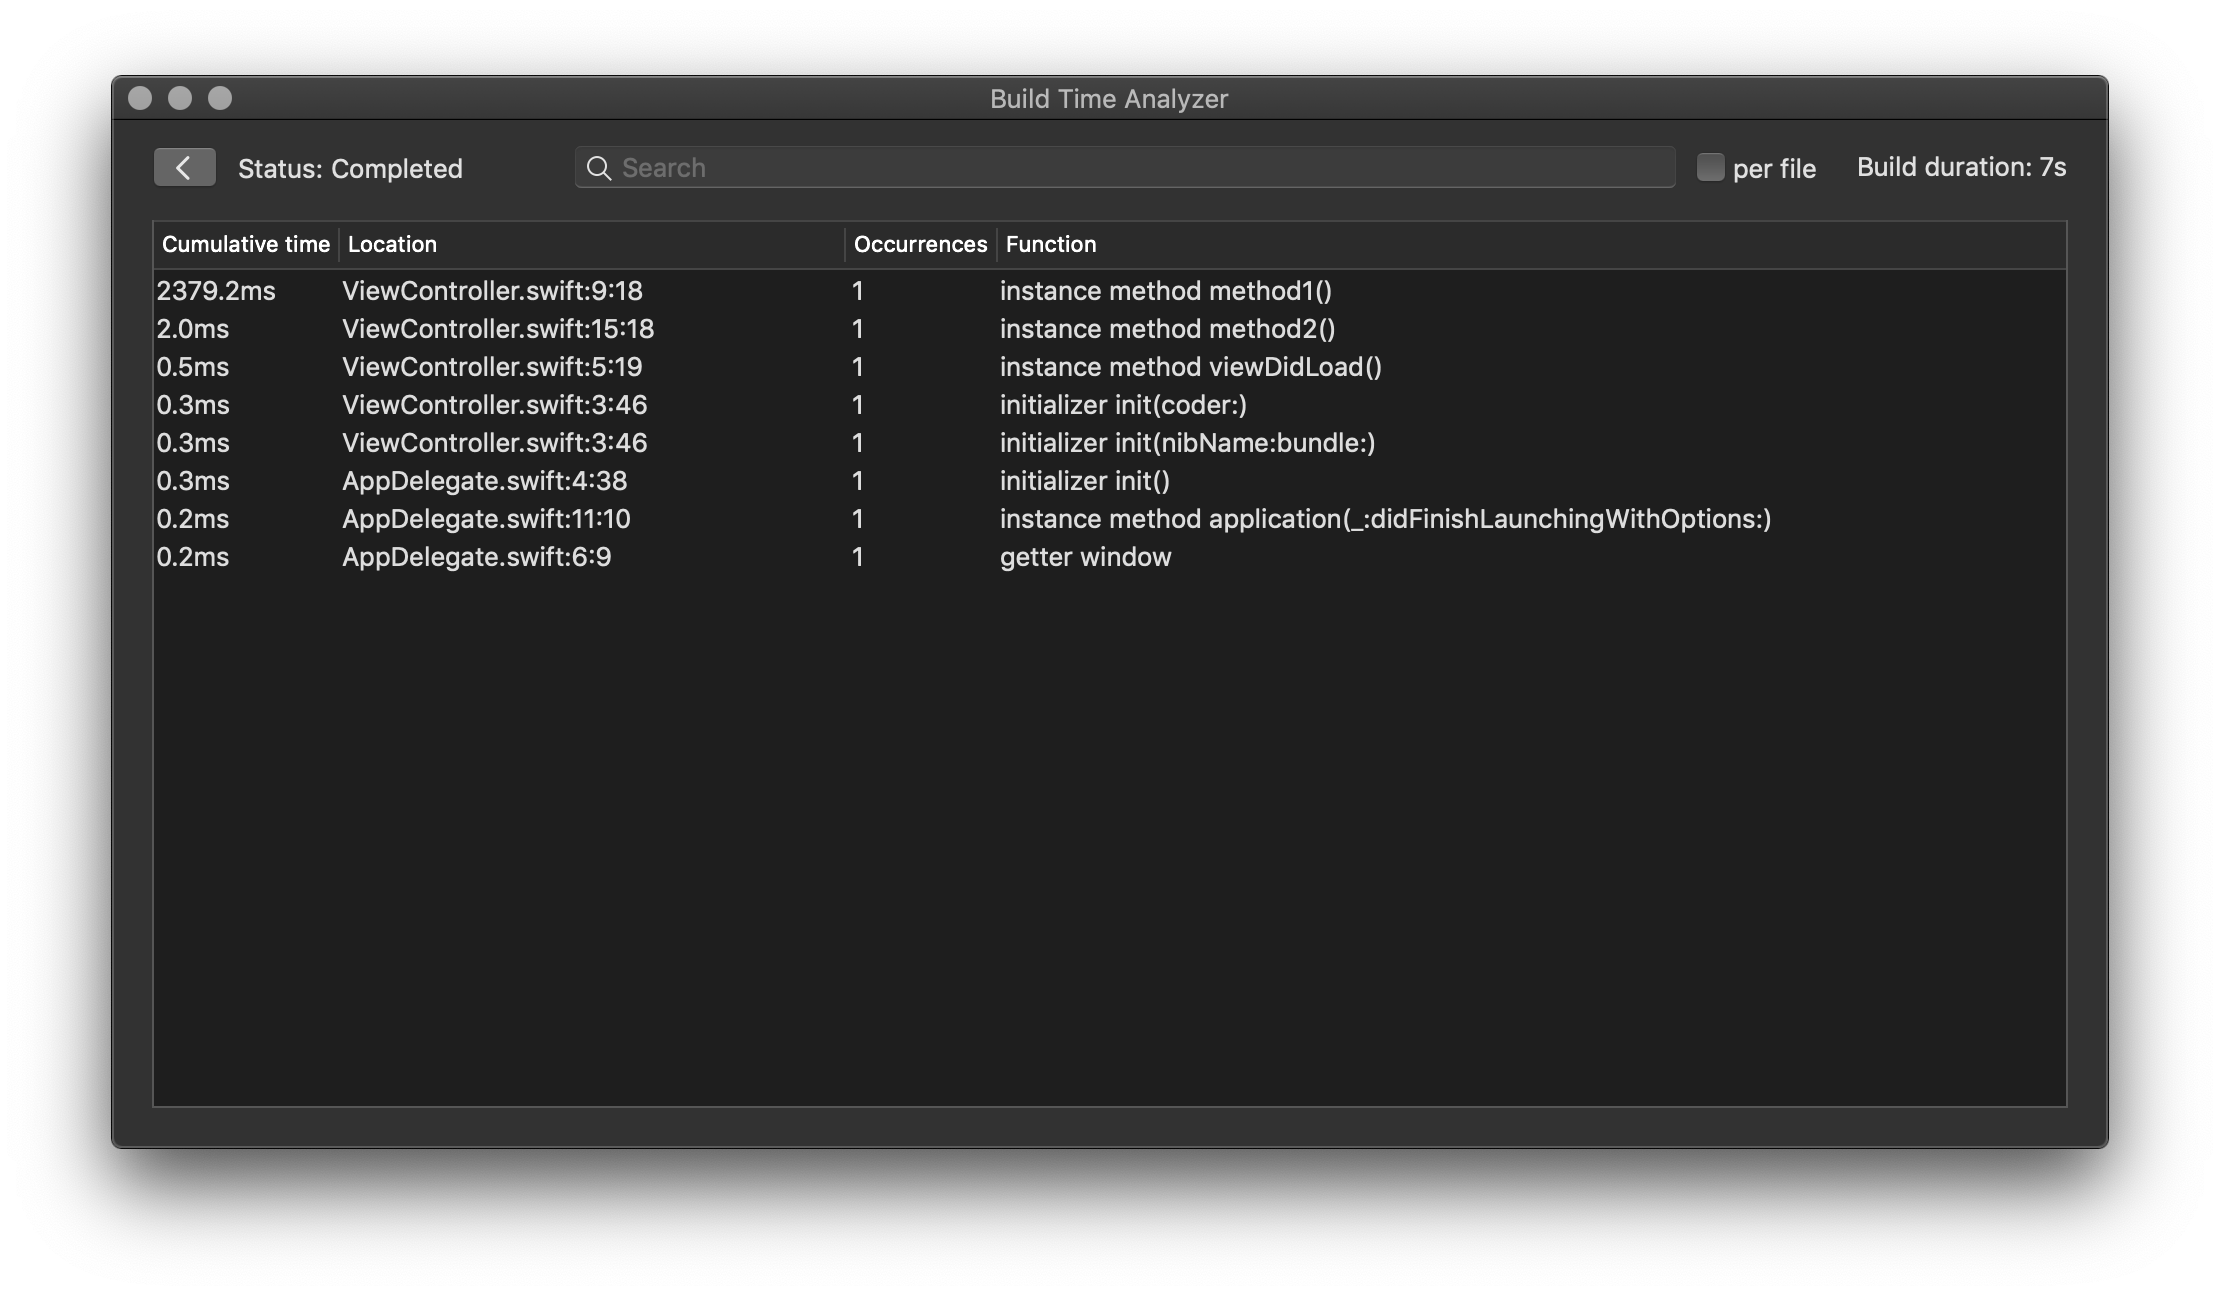
More robust approach is using Build Time Analyzer for Xcode. You can look at the compile time of a specific class (or even the particular method) using GUI.
Follow the steps included in the README.md to use this tool (mostly it is about adding OTHER_SWIFT_FLAGS = "-Xfrontend -debug-time-function-bodies" in .pbxproj file). After that you can visually notice which particular method has the longest compile time. Now you know which places need more love from your side.
The example used in this post can be found here: Measuring Compile Time Example.
Conclusions
- Before doing any improvement - measure the impact!
- Use a
Report navigator / simple script / Build Time Analyzer to measure compile time. - After measuring the compile time, improve the code / enviroment and measure it once again. Now you can be sure what kind of impact has the implemented change.